Spectral Processing Tools
Introduction to the SpectPro software
The IDAT/SpectPro software
IDAT/SpectPro is a spectral processing software developed by UVa to process spectral data, and with direct interface to access the PTAL Database information.
SpectPro is a standalone application for spectral analysis that needs to be downloaded and installed (currently available for Windows -MAC soon-). The user credentials are the same as for the PTAL database. This tool allows performing individual and multi-spectra operations such as labelling, trimming, shifting, normalization, baseline correction, and also features a general-purpose spectrum calculator to perform lineal combinations, product, division, derivative of spectra (among others).
It is possible to use SpectPro to directly connect to the PTAL DB.
Detailed information about the technical aspect of the SpectPro software are available at the following link (https://ui.adsabs.harvard.edu/abs/2020EPSC...14.1018V/abstract), while a step by step demonstration of SpectPro tools is provided in a dedicated video tutorial (https://www.youtube.com/watch?v=tuj7Yt3E0aE).
SpectPro download and installation
Once logged in the webpage (http://erica.uva.es/PTAL/), the SpectPro installer can be downloaded to the PC (Figure 1). The installation process will be performed automatically by executing the downloaded file. The software is available for both Windows and MacOs operative systems.
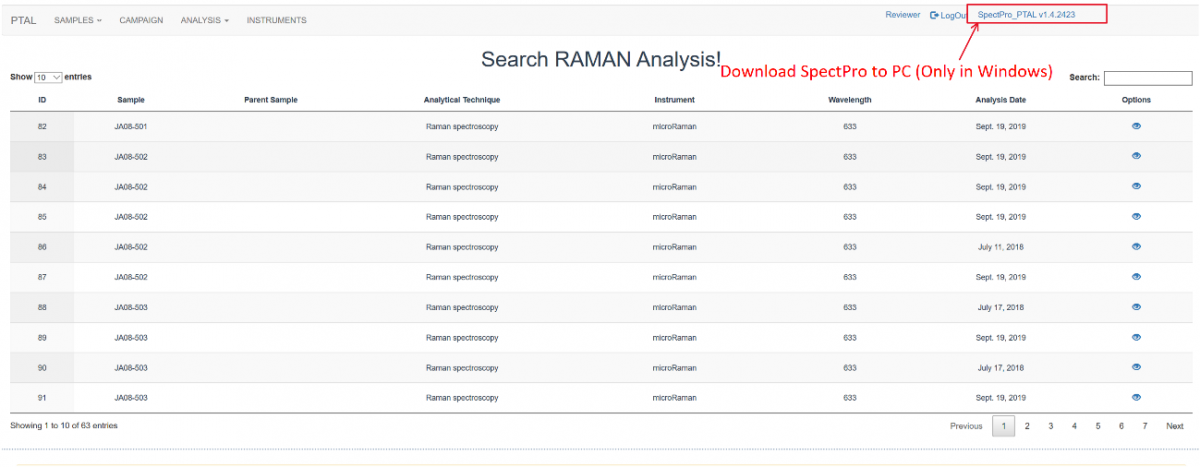
Figure 1: SpectPro download link in the PTAL webpage
SpectPro connection and data retrieving from the PTAL DB
The same credentials as for the webpage need to be used to login in order to use SpectPro. Internet connection is required for login.
In order to retrieve data from the PTAL database, the database interface is open as shown in the Figure 2.
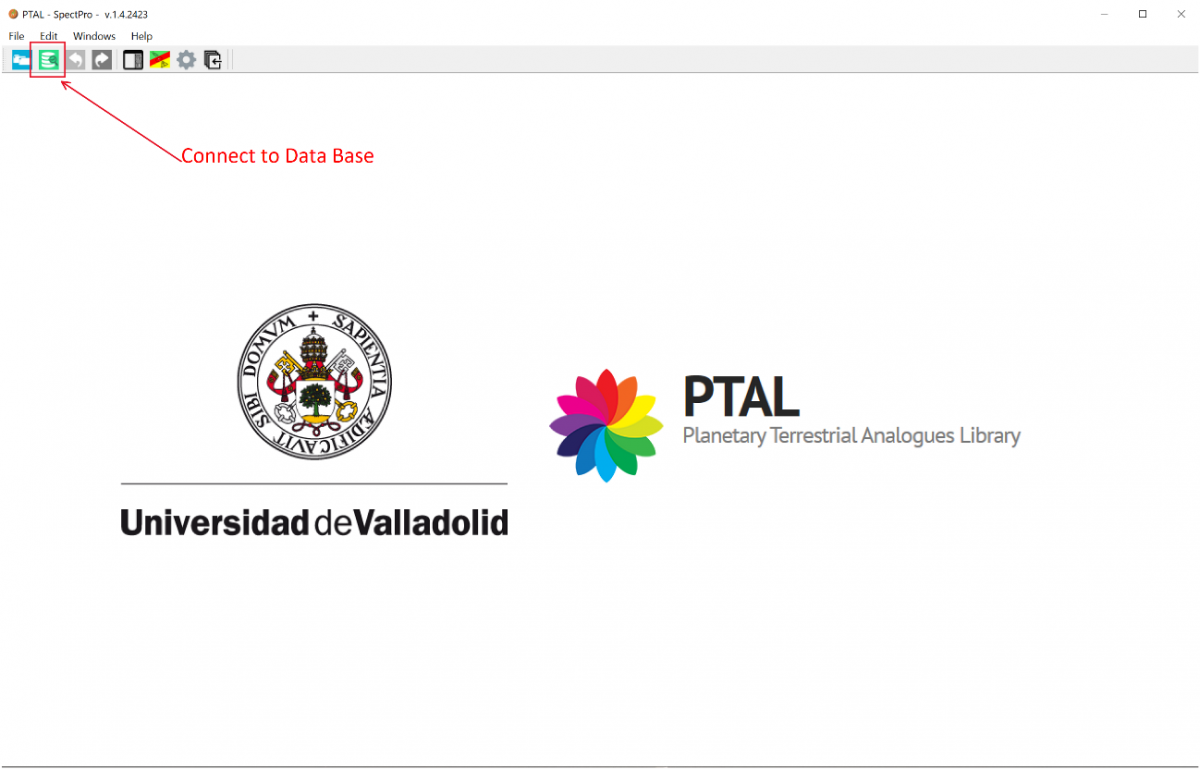
Figure 2: Screenshot of the SpectPro PTAL DB interface
It is possible to perform searches by SAMPLE and ANALYSIS. The search fields can be selected in the dropdown menu. After executing a search, the results list appears. By double clicking, the details of the selected search result are displayed (see Figure 3).

Figure 3: SpectPro search results
If the search is done by sample (see Figure 4), all the analysis related to the sample will be displayed, including the summary of results (lower table). Then, the analysis details can be accessed by clicking open.
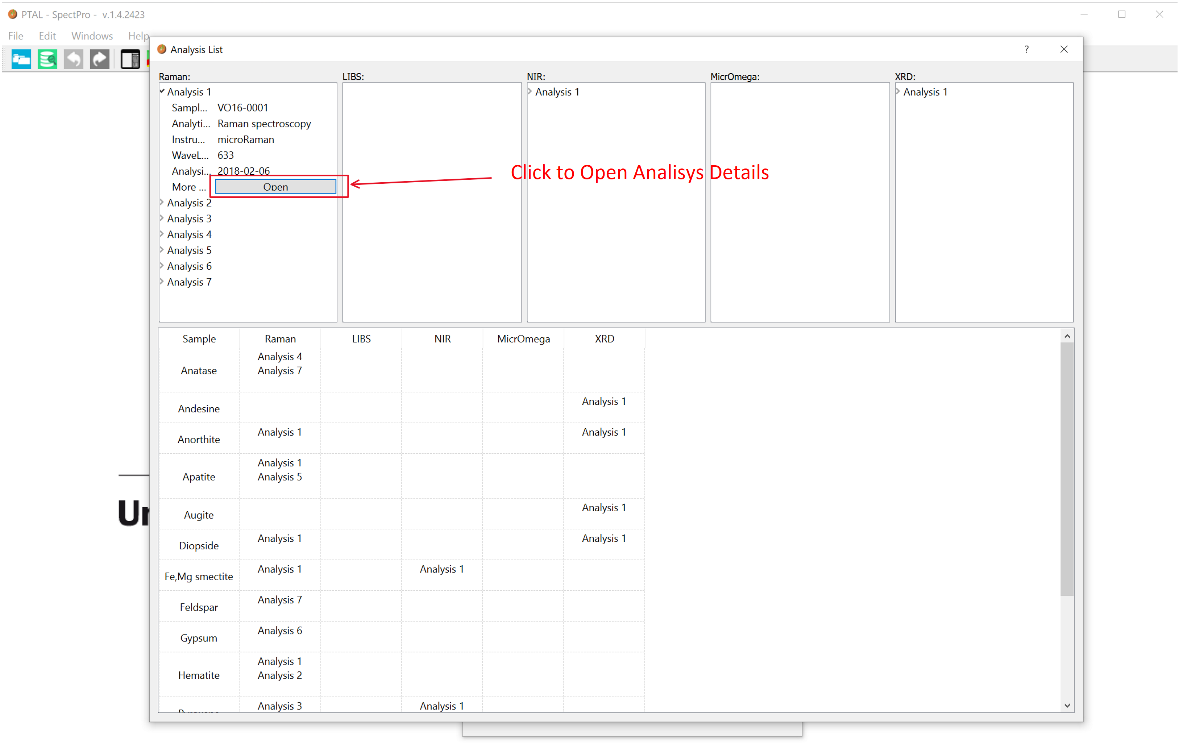
Figure 4: Sample results
If the search is done by analysis, or the analysis detail are opened from the sample analysis list, the window on the right is shown, with all the analysis details, including the related spectra. By clicking on the spectrum name a preview of the spectrum is shown. By clicking download, the spectrum is loaded into SpectPro working area (see figure 5).

Figure 5: Analysis results
SpectPro tools for data treatment
The SpectPro software is intended for the management and analysis of spectra. SpectPro allows to open multiple windows and tabs inside a window to manage multiple spectra at the same time.
This software is designed to provide the user with different tools and information in four different panels:
- The central panel is where the spectrum is represented.
- The session data panel shows two tabs with all the spectra and operations performed in the current session (including all windows). Clicking or double-clicking a spectrum brings it to the front. The lower part of the panel shows the information of the selected element.
- The Session window shows the spectra and operations performed on the active window. Clicking or double-clicking a spectrum brings it to the front. The lower part of the panel shows the information of the selected element.
- The tools panel contains all the tools to perform operations on the spectra.
As can be observed in Figure 6, the software provides two plot/graphical areas in the image. The upper one is used to see the spectra in detail. The lower one always presents a general view of every spectrum at that plot.
Once a spectrum is loaded in SpectPro (either from the database, or from a tab/comma/semicolon separated file such as csv or xy), several tools are available for operation on the spectrum. After clicking on an operation, several options for configuration are available.
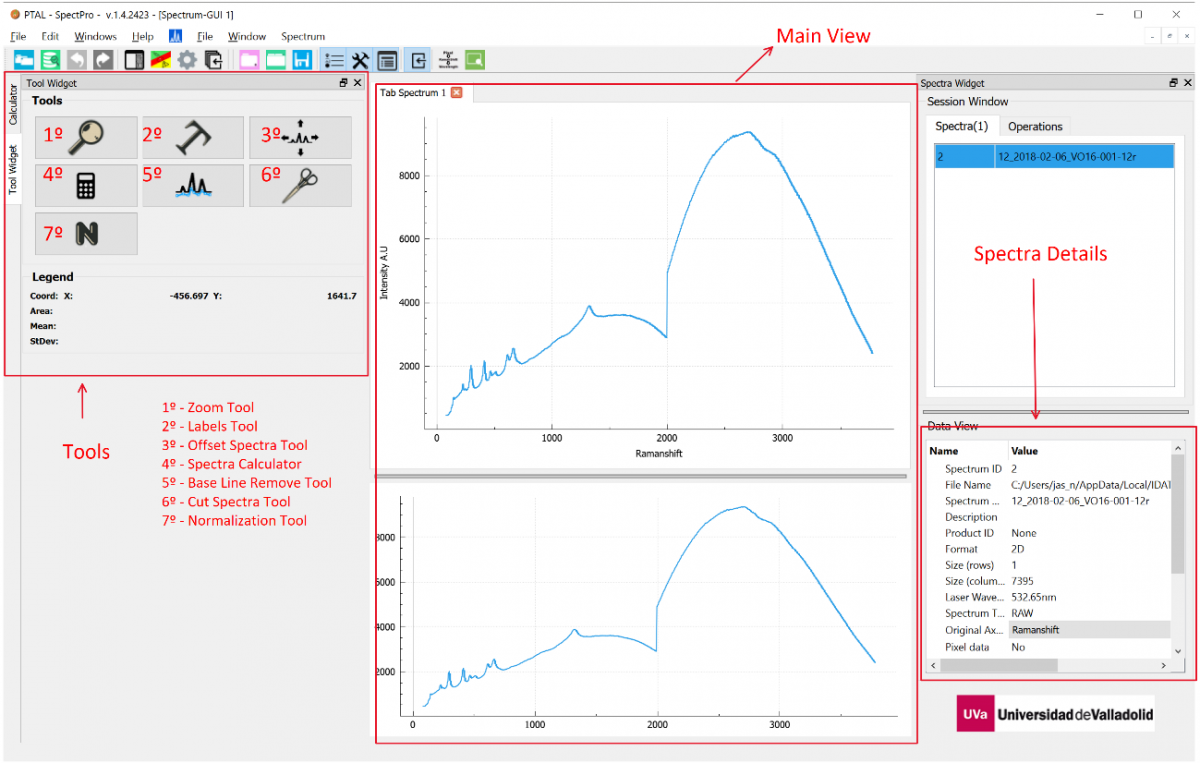
Figure 6: SpectPro main view with tools
Zoom: The UI of SpectPro is one of its key features. The mouse wheel is used to zoom in and out on a determined point of the image/spectrum. Also, if placed on one of the axes, it will zoom only in that axis. Also, it is possible to displace the spectrum with the right button of the mouse. In order to perform a precise zoom it is possible to draw a rectangle on the image/spectrum with the left button of the mouse. In addition, it is possible to manually indicate the zoom coordinates by clicking on the Magnifier tool on the tools panels. The zoom can be reset with the mouse wheel (back), but also with the contextual menu (right click -> reset zoom) or with the reset menu button in the menu bar.
Labelling. The labelling tool  can be used to create graphic labels on the spectrum. These can be added, removed and moved

 .
.
Spectrum shift: This tool allows to vertically shift (drag and drop) the spectrum for visualization purposes. However, by clicking on “Save spectrum” option, the spectrum data is updated with the current position.
Spectra calculator: The spectral calculator is a special tool with a specific interface which allows to perform all kinds of operations between spectra, which is useful for derivative analysis, intensity correction, or simply linear combinations of spectra for differential calculations.

Spectra calculator
Baseline correction: The baseline removal operation can be performed on one or several spectra at the same time. If the one-by-one option is selected, then it is possible to modify the parameters for each spectrum, or to skip it from being modified. If not, a batch operation will be performed on all the selected spectra. Either manual or automatic baseline correction can be performed.
Cut spectra: This tool allows cutting a spectrum to get a reduced spectral range by removing the upper or lower wavenumbers to the desired range. This tool is useful to improve the behavior of some baseline correction operations.
Normalization: The normalization of spectra is key for quantitative analysis of data. The normalization of the spectra in SpectPro can be either done taking into account the whole spectral range, or only the current zoom view range.