Spectral Characterization of the terrestrial field samples (WP2)
Improving the analytical setups for the characterization of PTAL samples
One of the main advantages of the PTAL project is to provide the scientific community with a database of LIBS, NIR and Raman spectra collected by analytical instrument derived from current (NASA/Curiosity) and forthcoming (ESA/Rosalind Franklin) rover missions to Mars.
In detail, the PTAL database includes NIR and Raman spectra that have been collected from PTAL analogues by means of the MicrOmega spare flight model (FS) and the RLS simulator (Sim) respectively. Prior to their use, both setups have been optimized with the purpose of improving their usability.
On one hand, the configuration of the RLS-Sim, resulting from the improvements carried out in the framework of the PTAL project, has been described in Lopez-Reyes et al. (2021, Journal of Raman Spectroscopy). The RLS-Sim is a flexible model of RLS that operates similarly to the actual instrument, both in laboratory and field conditions, while also emulating the rover operational constraints in terms of sample distribution that are relevant to the Raman analysis. This system can operate autonomously to perform RLS-representative analysis in one or several samples, making it very useful to perform heavy experimental tasks that would otherwise be impossible using a flight-representative model of the instrument.
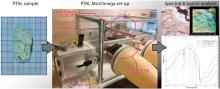
On the other hand, a dedicated semi-automated setup was built to facilitate the laboratory analysis of the PTAL samples by the spare model of the MicrOmega instrument. As described in Loizeau et al. (2020, Planetary and Space Science) the laboratory setup hosts the instrument in a dedicated clean chamber within a glovebox. It was designed to fulfil several requirements, including 1) have both the instrument and the samples in a thermally controlled and dry atmosphere, 2) ensure a highly accurate sample positioning, and 3) ensure protection from dust.
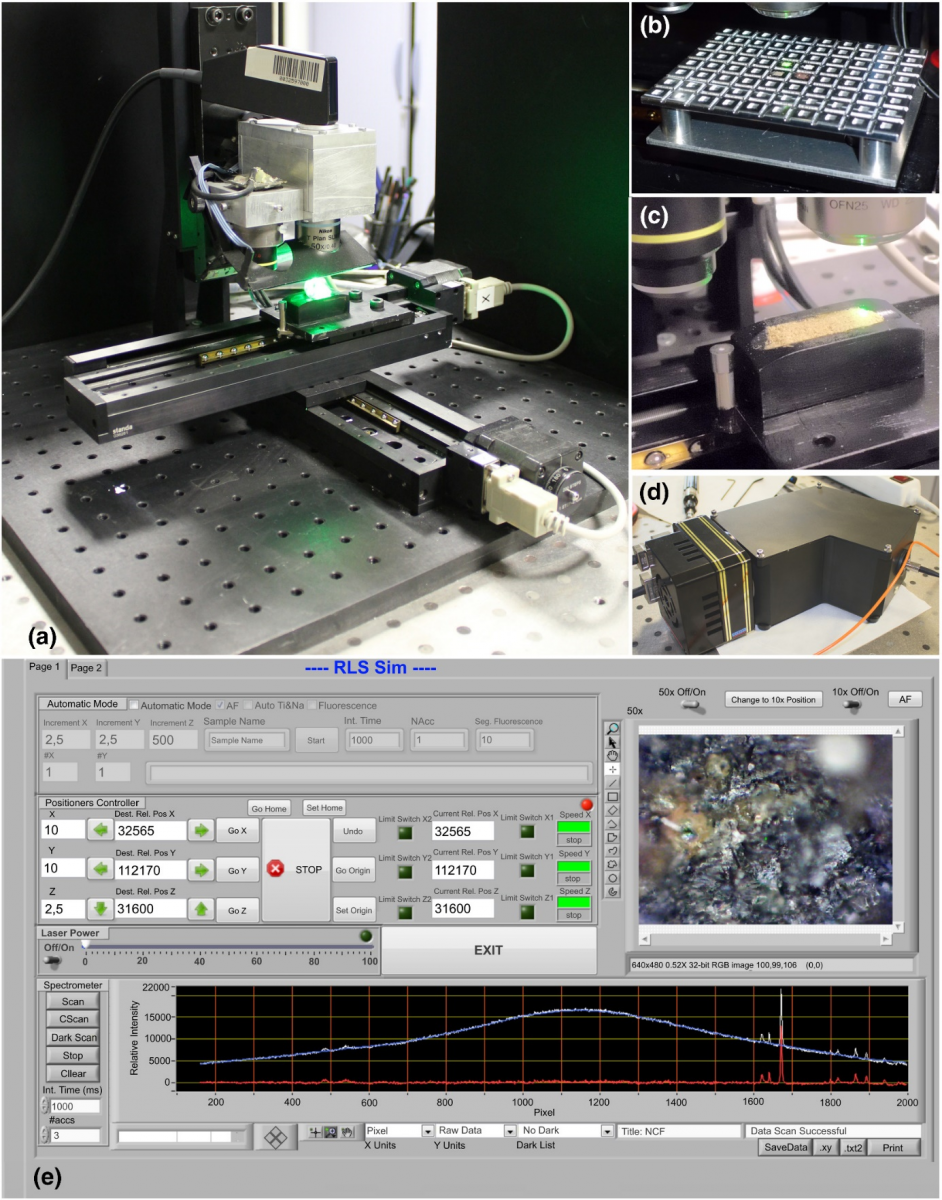
The Raman laser spectrometer (RLS) ExoMars Simulator (RLS Sim) (a). Multisample container for automated analysis on multiple samples (b). ExoMars-like sample container (c). RAD1 spectrometer (d). Labview-based control software (e)
Raman data overview of the PTAL samples
Following the acquisition of over 4500 Raman spectra over all the PTAL samples, we confirmed that Raman spectroscopy is able to reveal the complex mineralogical composition of a wide variety of terrestrial analogues, providing results in accordance with analytical studies presented in previous works, and detailed in Veneranda et al. (2020, Journal of Raman Spectroscopy). Beyond the PTAL project, the data summarized in this works also helps to shed light on the potential contribution of Raman spectroscopy to the mineralogical characterization of extraterrestrial bodies. On one hand, the characteristic vibrational Raman spectra provided by minerals (and potential biomarkers) are characterized by the presence of very sharp and well separated peaks, which facilitate the proper characterization of the analysed material even in the presence of complex mixtures. On the other hand, being the spot of analysis of micrometric size, a multipoint procedure enables the detection of minor and trace compounds that cannot be easily detected by other techniques. In the light of the forthcoming ExoMars mission, the comparison figures and tables presented in the article proves that the spectra obtained by means of the RLS ExoMars Simulator are qualitatively comparable with those obtained with the microRaman laboratory system, which is an excellent indicator of the scientific capabilities of the RLS spectrometer that will land on Mars in 2020.
A large number of these spectra are available in the PTAL spectral database, but the PTAL project also provides users with spectra-treatment tools and physical access to the 94 terrestrial analogues. In this sense the PTAL information system aims to become a cornerstone tool for the scientific community interested on deepening the knowledge of geological processes that occurred on Mars and other extraterrestrial bodies.
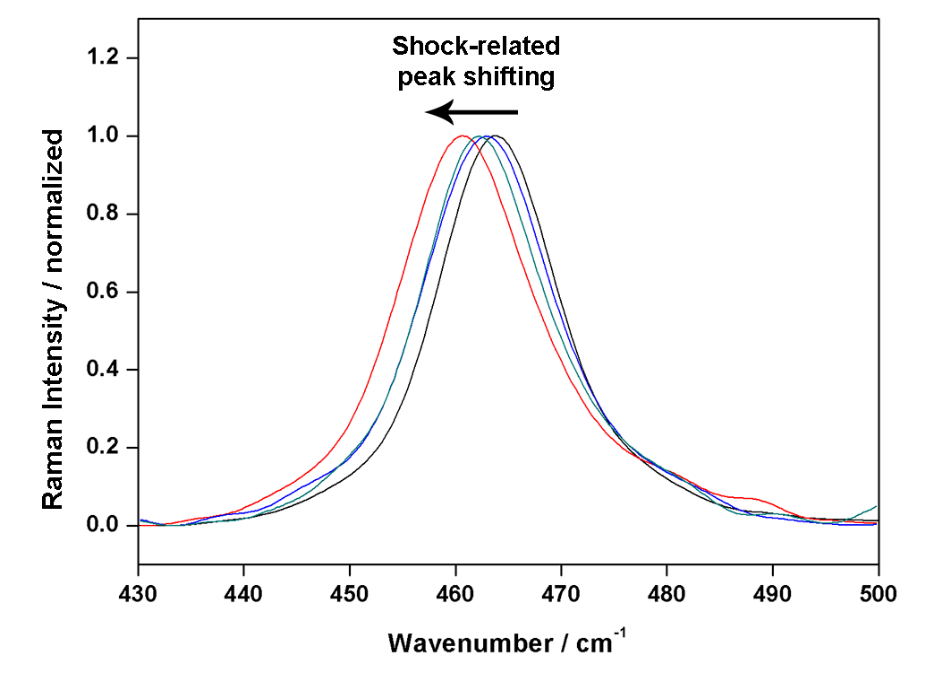
Comparison of Raman spectra collected by means of the microRaman system from different quartz grains of sample WH16-0014. The observed peak shifting is related to the shock-amorphization of the crystals caused by the impact.
Near InfraRed data overview of the PTAL samples
All the PTAL samples have been investigated using two NIR (Near InfraRed) techniques: we used a commercial point spectrometer, and a NIR hyperspectral microscope developed in particular for ExoMars, MicrOmega. The use of the MicrOmega instrument, a flight-spare of the MicrOmega model set on the Rosalind Franklin rover, required the development of a dedicated set-up to analyse samples in the best conditions while preserving the safety and cleanliness of the flight spare model (Loizeau et al., 2020, Planetary and Space Science). The point spectrometer was used on crushed powders made from the samples, while MicrOmega was used mainly on slices of the samples, or powders when slices could not be sawed. The whole set of samples has been first characterized with the commercial spectrometer and presented in Lantz et al. (2020, Planetary and Space Science), and then characterization of the samples with MicrOmega has been published in Loizeau et al. (2021, Astrobiology, in press).
We could identify a large variety of minerals, and map them with MicrOmega. In particular, hydrated minerals are the easiest to detect and map, showing great complementarity with the Raman spectroscopy. The use of both the commercial point spectrometer and MicrOmega proved to be complementary as the point spectrometer has a slightly larger spectral domain and better spectral resolution, but the imaging capabilities of MicrOmega offer ways to identify minor species that could not be detected with the point spectrometer.
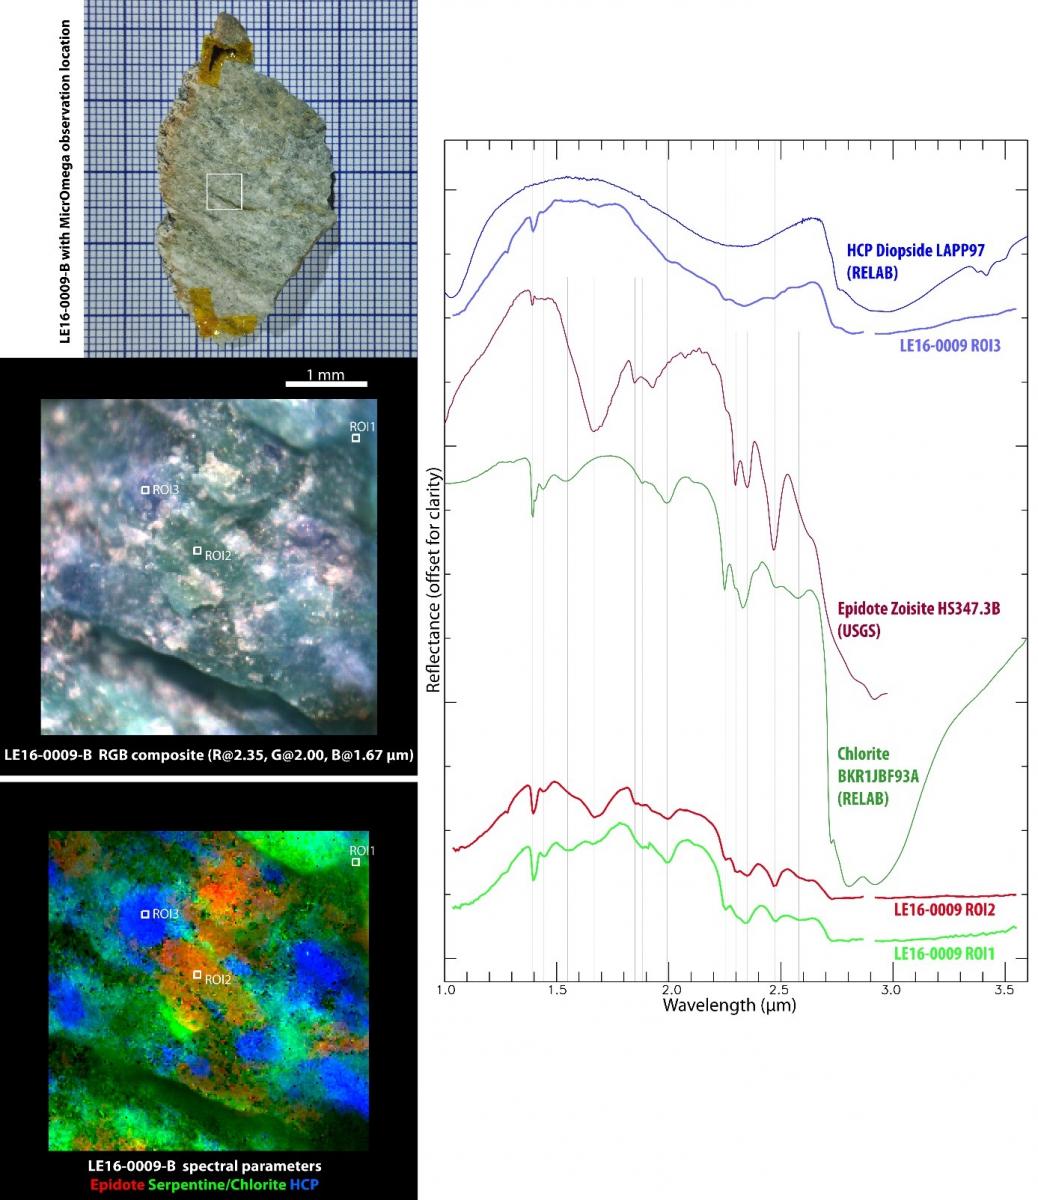
Example of a sample characterization with MicrOmega. Left, from top to bottom: picture of the rock slice, color composite image in the NIR with MicrOmega, spectral parameter map. Right: some MicrOmega spectra compared with laboratory references.
Characterization of analogues to Oxia Planum rocks
Oxia Planum is the site where the ESA mission ExoMars will land the Rosalind Franklin rover in 2023. The orbital studies of this site shows the presence of phyllosilicates. We searched for the best Earth analogues to these Oxia Planum rocks, and studied in particular rocks from Otago (New Zealand) and Granby (Massachusetts, USA), and published our findings in Krzesińska et al. (Astrobiology, 2021).
The terrestrial Fe-rich, trioctahedral vermiculite deposits from Otago schists and Granby basaltic tuffs match very well with the NIR spectrum of the Oxia Planum bedrock. A vesicular basalt with amygdales infilled with vermiculite and very minor saponite is the best spectral analogue found so far for the clays at Oxia. This spectral analogy suggests that phyllosilicates at Oxia formed by either anoxic alteration of chlorite or as ash-fall deposits.
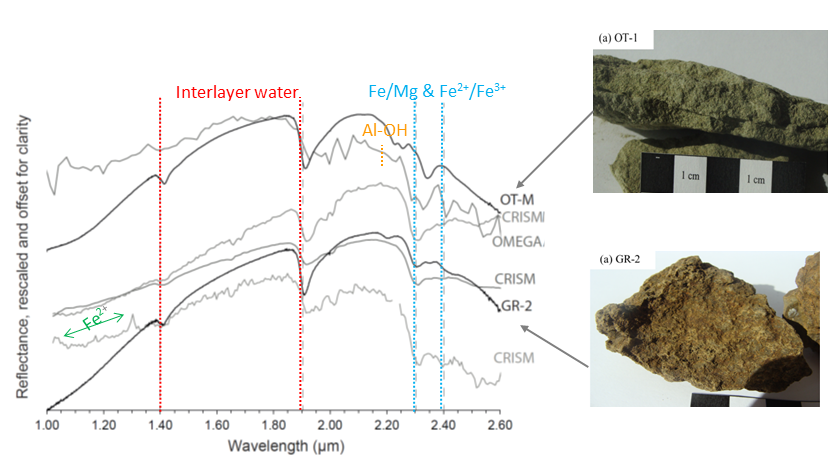
Spectra of terrestrial analogues (Otago and Granby) compared with spectra of Oxia Planum (from OMEGA and CRISM orbital data).
Spectroscopic study of olivine-bearing rocks and its relevance to the ExoMars rover mission
In this study, detailed in Veneranda et al. (2019, Spectrochimica Acta), the NIR technique ensured an accurate overview of the mineralogy diversity of the sample, while the Raman technique was able to detect minor compounds that were not identified by NIR and XRD analysis. Considering that the Analytical Laboratory Drawer of the ExoMars rover will provide the possibility of performing combined or cooperative science between the MicrOmega (NIR) and RLS (Raman) spectroscopic systems, this practical proof of the complementarity of NIR and Raman data in the mineralogical determination of Martian analogues is a promising result in the perspective of the forthcoming ExoMars/ESA mission. With regards to the Raman characterization of the samples, RLS ExoMars Simulator results fit with those provided by the state-of-the-art laboratory system. Considering that the RLS ExoMars Simulator has been used by simulating the analytical routine that the RLS will follow on Mars, this work confirms that a full picture of the mineralogical heterogeneity of powdered samples can be obtained through the automatic acquisition of 40 spectra.
Among the obtained results, it must be underlined that the RLS ExoMars Simulator was able to clearly detect the whole set of spectroscopic features (main and secondary peaks) of all main phases (a detail of critical importance in the identification of the correct phase within a mineral group). More important, the RLS ExoMars Simulator was also capable of detecting the shift of the characteristic double peak (820-850 cm-1) of olivine. Considering that this phenomenon is linked to the Fe/Mg ratio within its crystalline structure, this work suggests that the ExoMars/RLS has the potential to provide detailed information about the elemental composition of olivine on Mars. From the promising results obtained in this study, the RLS science group intends to deepen the study of the double peak shifting. The purpose is to formulate an empiric equation that, taking into account the analytical features of the RLS, will allow to precisely calculate the Fo/Fa ratio from the olivine spectra that will be collected on Mars.
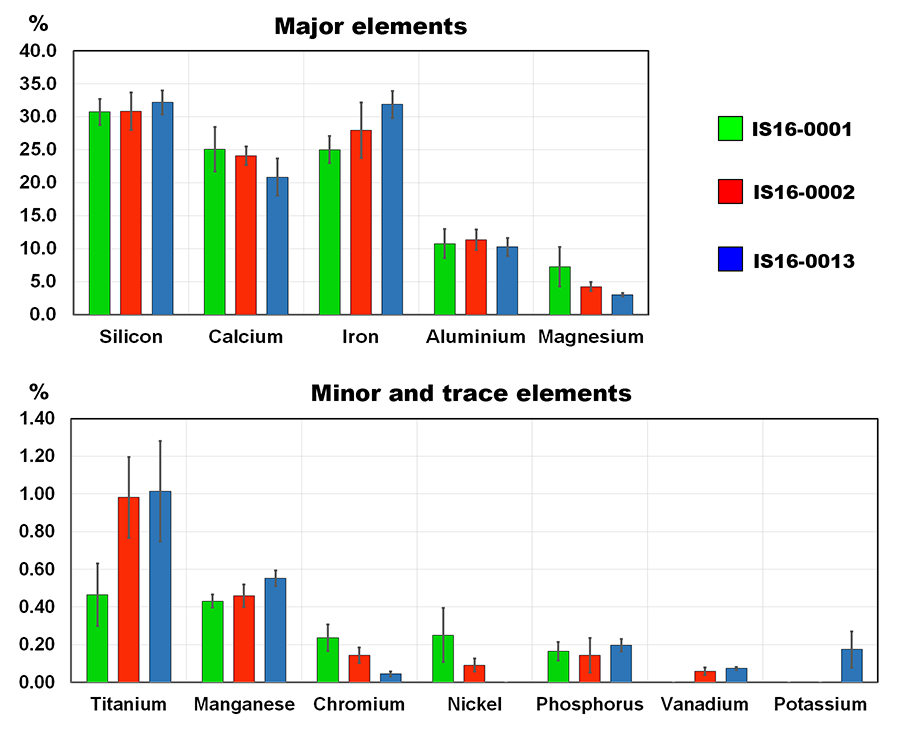
Semi-quantitative elemental data obtained from the study of powdered samples by means of the XRF spectrometer.
Raman semi-quantification on Mars
In three published studies in 2020 and 2021, we tested ways for mineralogical semi-quantification with the ExoMars RLS system. In a first study focused on semi-quantification of olivine and pyroxene, Veneranda et al. (2020, Nature Scientific Reports) show that by extrapolating calibration curves, it was possible to estimate the relative content of these two mineral species in terrestrial analogues, after a minimum points of analysis. In light of the forthcoming ESA mission to Mars, Veneranda et al. (2021, Icarus) suggest that through the development (and further optimization) of dedicated chemometric models, the RLS spectrometer onboard the Rosalind Franklin rover could be potentially used to semi-quantify the main mineral components of unaltered basaltic rocks. It is important to underline that, when it comes to the Raman semi-quantitative analysis of real Martian samples, complications could arise from 1) additional minor compounds with spectral features located in the spectral regions selected for chemometric analysis, and 2) different degree of crystallinity between Martian basaltic rocks and miner l specimens used for the construction of calibration curves. However some mitigations are under study: in the first case, the proposed chemometric model can be optimized by taking into consideration a wider set of vibrational indicators (maximum intensity position of additional peaks from different spectroscopic regions and their intensity ratio, see Table 04) that will make it more robust against possible spectral interferences induced by additional minor compounds. In the second case, errors deriving from the analysis of mineral species of different crystallinity could be minimized by analyzing additional spectral parameters of the mentioned peaks (e.g. area, symmetry and FWHM). These variables could help to correctly identify the mineral phases composing Martian samples.
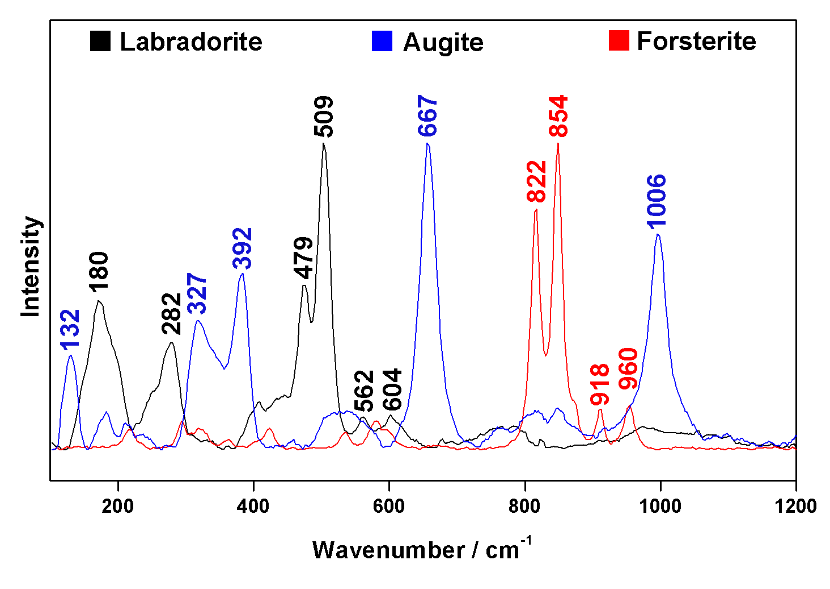
ExoMars Simulator’ characteristic spectra of labradorite, augite and forsterite mineral samples, which were used in this work as plagioclase, pyroxene and olivine proxies.
In addition, in Veneranda et al. (2021, Astrobiology), we used the set of samples from the Leka Ophiolite Complex (Leka is an island on the west coast of Norway) from the PTAL rock library to demonstrate the possibility of semi-quantification of the serpentinization degree of olivine-rich rocks. We proved in this study that Raman data can be used to estimate the Fo/Fa ratio of olivine grains as well as to distinguish the presence of different serpentine polytypes (lizardite and antigorite). Data sets gathered from the Raman study of standard mixtures also proves that the RLS ExoMars Simulator can detect both olivine and serpentine down to a concentration of 1%. Furthermore, we also demonstrate that the RLS automatic operating mode allows the semi-quantification of the mineral abundance of binary mixtures. We applied olivine/serpentine calibration curves to the set of Raman data gathered from the Leka analogues. As suggested by the comparison with XRD semi-quantification data, Raman spectroscopy can effectively determine the degree of serpentinization of olivine-rich samples. Taking into account the importance of olivine serpentinization related to microorganisms proliferation and biomarkers accumulation, the results presented in this work underline the key role the RLS system will play in the selection of the optimal scientific target rocks to be studied on Mars for the detection of life tracers.
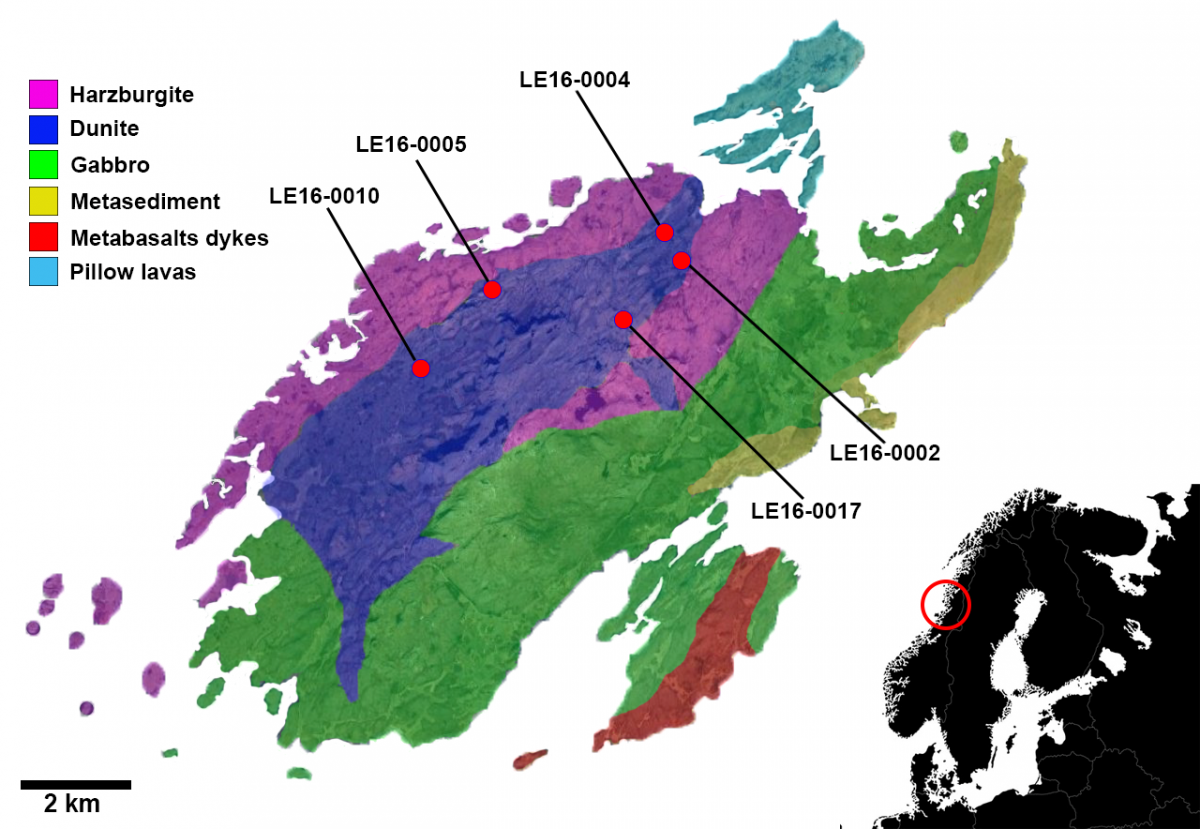
Simplified geological map of the Leka Ophiolite Complex, indicating the sampling site of the analogue materials studied in this work.
Raman in Earth Analogue Campaigns and detection of biomarkers
Trials field campaigns, named ExoFit have been conducted by ESA in different places on Earth to prepare for the ExoMars surface mission with the Rosalind Franklin rover. In Veneranda et al. (2021, Microchemical Journal), we describe the ExoFit campaign in the Tabernas Desert (Spain), operated from the UK. The analysis of the Raman data from this campaign shows that the RLS simulator could detect minor and trace compounds, both mineral and organic. The Raman activities at the ExoFit campaign in the Atacama Desert (Chile) are described in Veneranda et al. (2021, Nature Scientific reports), here again the complex mineralogical composition was characterized with the RLS prototype, but other signals that could be biomarkers were also detected. This work suggests that RLS could detect potentially astrobiological-relevant signatures at the subsurface of Martian-like environments, and help in the selection of targets to be analysed by the MOMA instruments on the Rosalind Franklin rover.
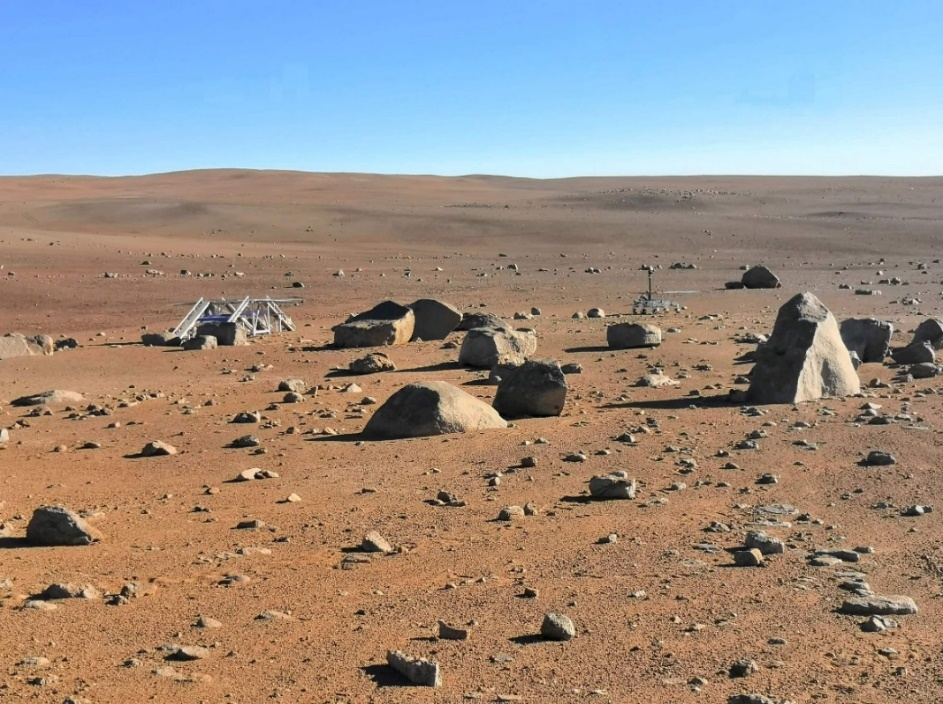
Image of the desertic area selected for the ExoFiT trial (Atacama Desert). The ExoMars rover and landing platform emulators can be observed.
In a broader context, in Rull et al. (2021, Analytica Chimica Acta) we discuss the capability of Raman spectroscopy to gather mineralogical data qualitatively comparable to those provided by further analytical techniques that have been successfully employed on Mars in previous rover missions (e.g., Mössbauer and X-ray diffractometry). Compared with these, Raman spectrometers proved to effectively detect organics within analogue geological samples, thus confirming the potential key role this technique could play in the fulfilment of the main objective of both ExoMars and Mars 2020 missions: to detect clues of past or present life on Mars. Furthermore, the multianalytical investigation of terrestrial analogue materials confirmed the complementarity of Raman spectroscopy with NIR and LIBS systems, thus providing crucial information for the proper interpretation of the data returned by the Perseverance and Rosalind Franklin rovers. While confirming the complementarity between spectroscopic techniques, this study emphasizes that the experience gained by participating in mission simulations helped refine the analytical protocols to follow during nominal operations on Mars.
LIBS analysis of PTAL samples
LIBS (Laser Induced Breakdown Spectroscopy) spectral measurements of the PTAL sample collection have been performed using the ChemCam/MSL replica at IRAP, Toulouse, France on the crushed powders also analyzed with Raman and NIR spectroscopy. As the SuperCam instrument is an evolved version of the ChemCam LIBS instrument onboard the Curiosity rover (see Figure below), the results obtained by means of the MSL replica are considered to be representative of the LIBS spectra the Perseverance rover is collecting at Jezero crater since February 2021.
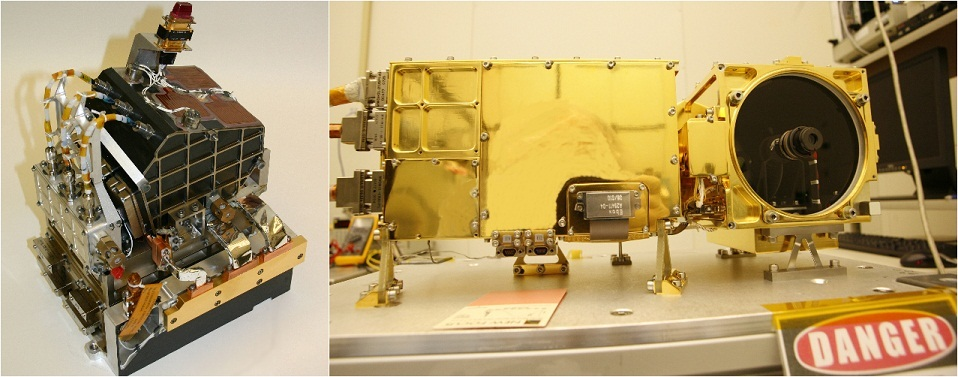
The two main parts of the ChemCam laser instrument for NASA's Mars Science Laboratory mission are shown in this combined image. On the left is the body unit, which goes inside the body of the mission's Mars rover, Curiosity. The mast unit on the right goes onto the rover's remote-sensing mast. Credits: NASA/JPL-Caltech/LANL.
Analyses were made on three spots for each sample, with 10 to 30 laser shots on each spot. Considering that a total of 97 Terrestrial analogues were analyzed, a total of 291 LIBS spectra were acquired.
After data acquisition, a dedicated table has been created for each sample that provides the list of detected major elements and minor elements. As represented in the figure below, the PTAL platform also provides, for each Terrestrial analogue, the representative LIBS spectra in both txt and jpg formats
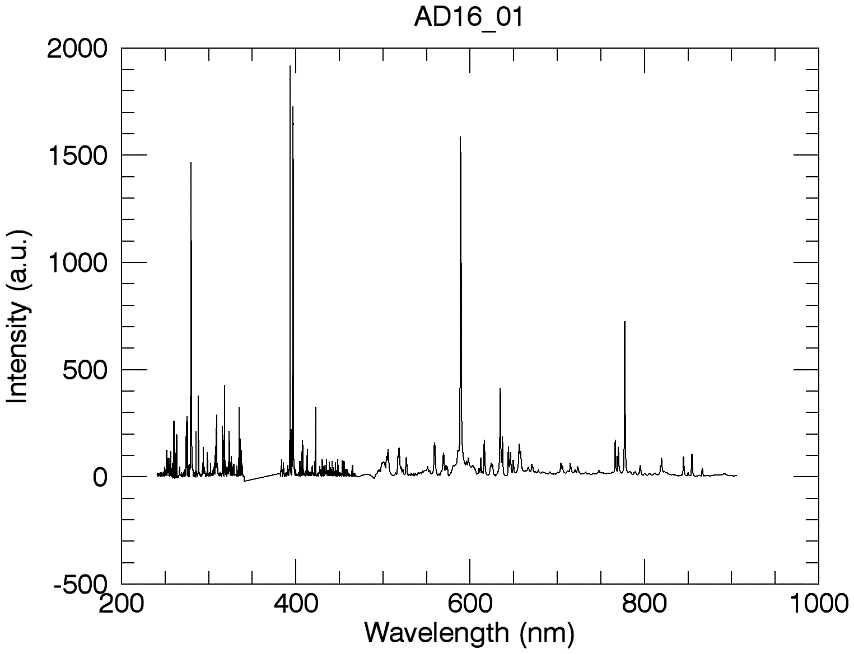
LIBS spectra detected buy the ChemCam/MSL replica from the study of the AD16-0001 sample (Tenerife, Spain).
Some comparative analyses have been performed between samples, such as a multivariate approach in order to differentiate the samples. We used the ICA (Independent Component Analysis) technique in order to find some correlations between the spectra and pure elemental components. At the end, with this technique, we can separate the spectra by their “score” (similar to a correlation coefficient) for different elements. The figure below shows an example, with the Mg vs Si scores. Scores don’t carry any quantitative information, but allow a qualitative comparison between data points. We can see that the Norway samples from Leka are the most enriched in Mg, and the most depleted in Si. This seems consistent with the results from the other techniques that showed that those samples are rich in serpentine. From this first analysis, it has also been shown that few samples are clearly more enriched in Fe, such as some Rio Tinto samples, that are also the most depleted in Si. This seems consistent with observation of Fe oxides from the other techniques. Also sample JD16_010 is the sample with the highest H signal. From XRD analyses, this sample contains some phyllosilicates, sometimes observed with MicrOmega and other IR techniques, minerals that can contain a lot of water.
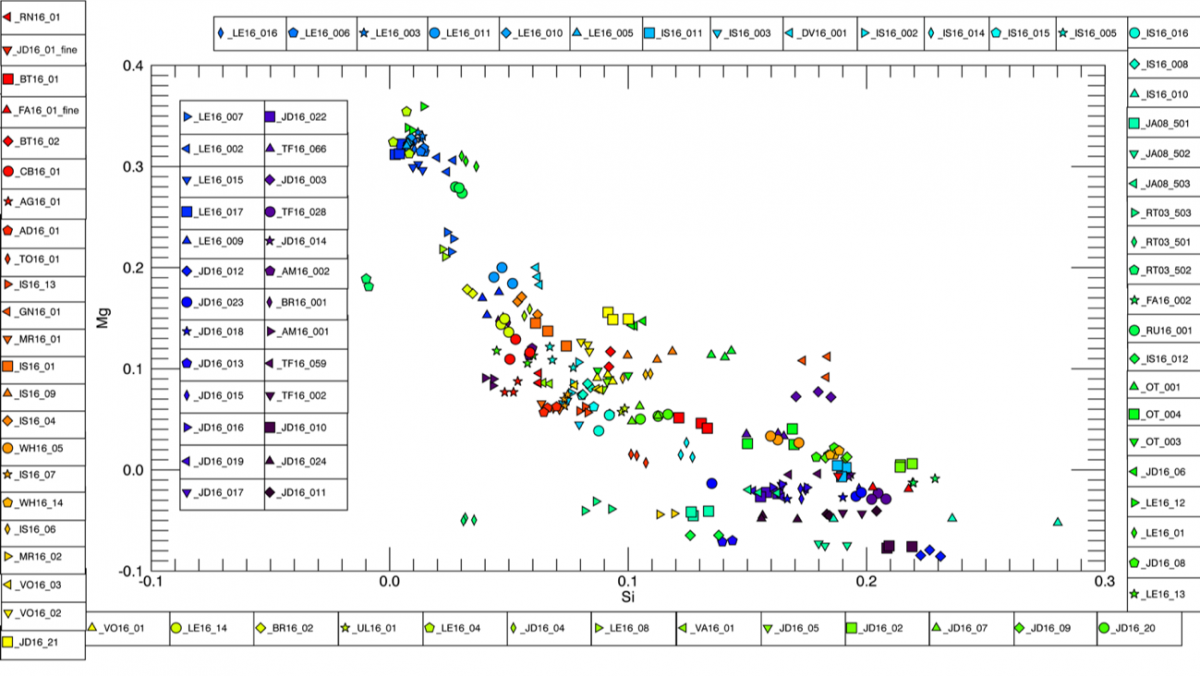
Mg vs Si scores from the ICA analyses of the 97 samples analyzed with LIBS. Red circle highlights the serpentinized samples from Leka, Norway. Each sample is shown with 3 points representing its 3 LIBS analysis spots. The sets of 3 points are always well correlated showing the homogeneity of the crushed powder at LIBS scale.
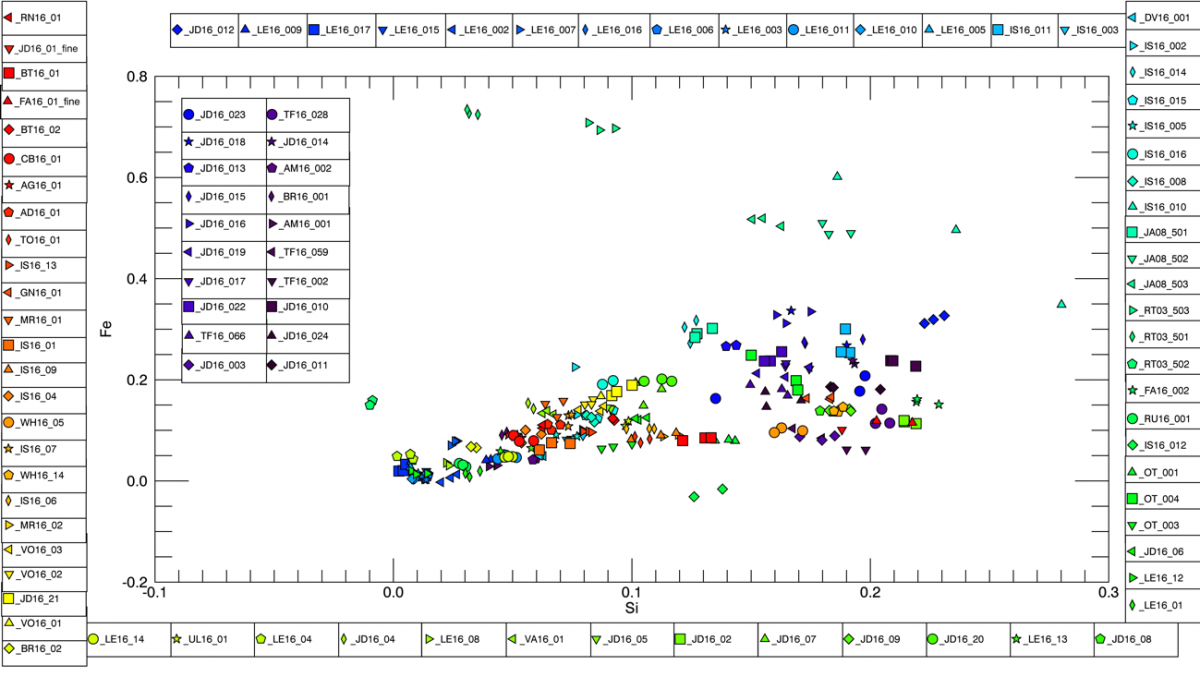
Fe vs Si scores from the ICA analyses of the 97 samples analyzed with LIBS. Red Circle highlights the sampled enriched in Fe oxides, RT03_501 and RT03_503 from Rio Tinto, Spain. Other samples particularly rich in Fe originate from Jaroso Ravine, Spain.